
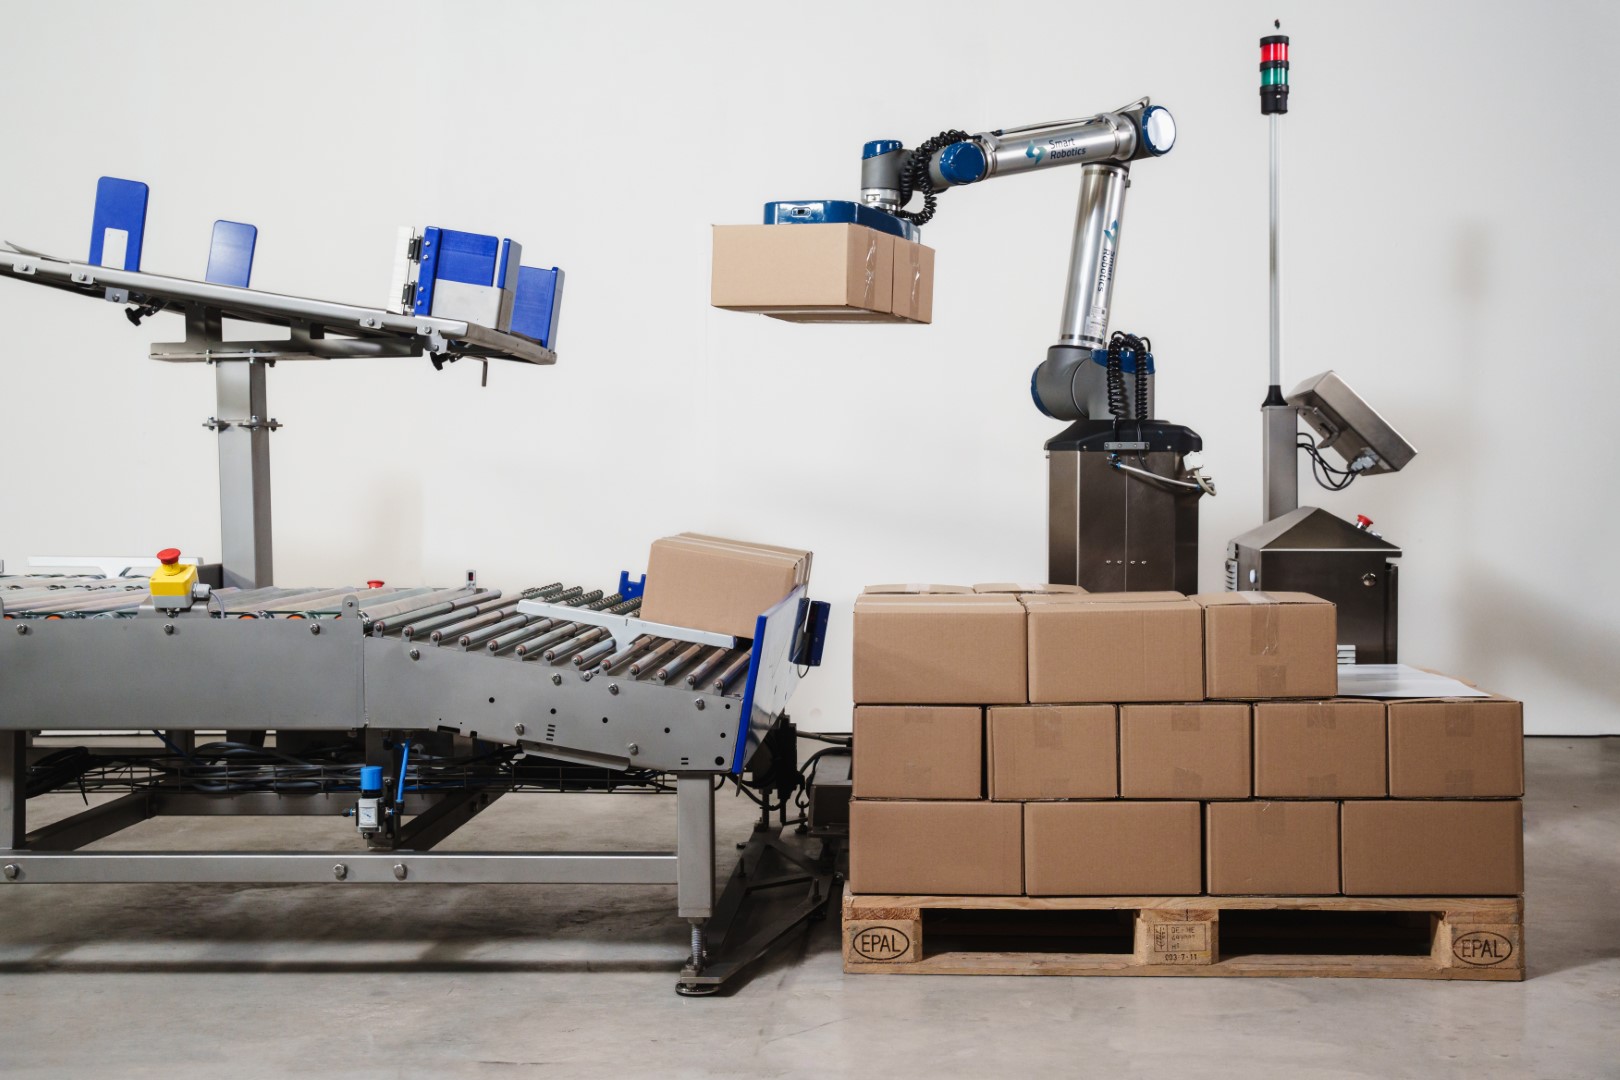
Most ROI guides for palletising automation are vague to the point of being useless. ‘It depends on your application’ helps no one. This one gives you a framework for calculating palletising robot ROI with real numbers, two worked examples at different ends of the viability spectrum, and an honest look at the variables that can push a project from 8 months payback to 3 years.
The core formula is simple: take what you spend on a robotic palletiser, divide it by the annual saving it generates, and you’ve got your payback period. The work is in filling those numbers in honestly rather than optimistically.
One thing to address first, before even looking at ROI figures, is can the cobot hit the throughput I need. Try our handy cobot palletising cell cycle time calculator, input your requirements and see what the calculator thinks.
Palletising robot ROI: what goes in the cost column
A cobot-based palletising cell can typically start at around £50,000–£80,000 for a single-product application. A traditional industrial robot cell, or layer palletiser, with full safety fencing and conveyor integration sits more like £80,000–£200,000, depending on throughput requirements and site complexity. Not sure whether you are looking at a cobot palletising cell or a traditional robot palletising cell? Our guide on the differences might help.
The quoted system price is only the starting point. Most operations also need to account for conveyor integration (connecting the robot cell to an existing packing line costs money, sometimes a lot of it), electrical work, compressed air installation and any civil preparation like floor levelling. A realistic rule of thumb is to add at least 15–20% on top of the cell price for implementation. Some integrators include this in their headline quote but many don’t. Ask explicitly before you start putting your numbers together.
Then there’s the soft cost column people tend to forget about, internal project management time, operator training, production downtime during installation (typically 1–3 weeks for a cobot cell, longer for a traditional system) and the first year or two of planned maintenance. None of these are enormous numbers individually, but they can add up and need to factor into any ROI calculation.
For a clear picture of what these systems include and what a typical UK installation actually looks like, the palletising application guide is worth reading before you start building your cost model.
What to put in the savings column
Labour is the main driver, but most operations undercount it. Don’t just use base wages. A palletiser on a 2-shift pattern earning £13/hour costs closer to £15–£16 per hour all-in once you add employer NI and pension. Layer in shift premiums if you’re running lates or nights. Add agency fees for absence cover if you’re relying on temps. Factor in recruitment and onboarding if turnover in that role is high, which it often is, because palletising is physically demanding work and people leave.
Throughput gains are worth including, but calibrate them carefully. A robot doesn’t slow down at the end of a shift, call in sick, or take a longer break on a Friday afternoon. If your current palletising operation creates a bottleneck that backs up the rest of your line, resolving that has genuine, measurable value. If there’s no bottleneck, throughput consistency is still worth something, it makes your line more predictable, but don’t book it as a saving equal to the labour cost you’re replacing.
Product damage is a line item many operations can actually quantify. Pallets stacked inconsistently or at the wrong weight distribution are more likely to shift in transit. If you’re absorbing claims from customers for damaged goods, run that figure back through three years of data and put it in your savings column. It moves the numbers more than people expect.
Injury-related costs belong there too if you have the data. Manual palletising is one of the higher-risk activities on a production floor in terms of musculoskeletal injury. Sickness absence, light duties cover, employer liability insurance premium increases, these are real costs. A health and safety manager will usually have figures that can feed a business case, even if the primary driver is financial rather than welfare.
Worked example one: a strong case
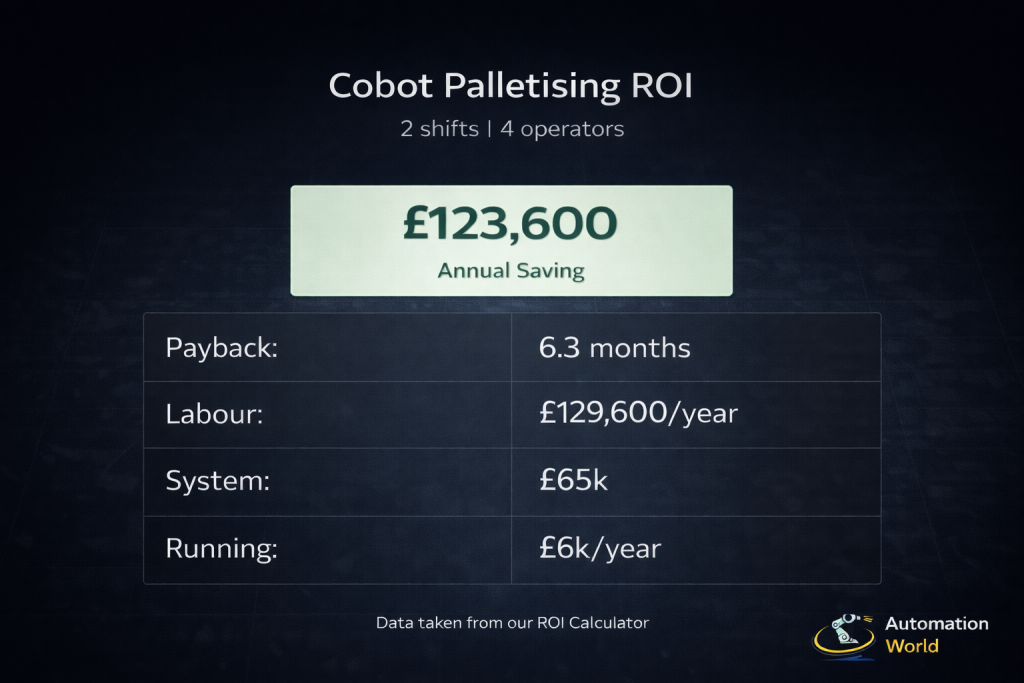
A food manufacturer running 2 palletising shifts, 2 operators per shift. Total palletising labour cost of £129,600 a year.
A cobot cell for that application, installed, costs £65,000. Running costs including maintenance, energy, consumables, come to around £6,000 a year. Net annual saving: £123,600. Payback: 6.3 months.
That’s the right end of the spectrum. A project like that has paid for itself before the robot has had its first service, and the business banks the saving every year for the decade-plus the system runs.
Worked example two: a borderline case
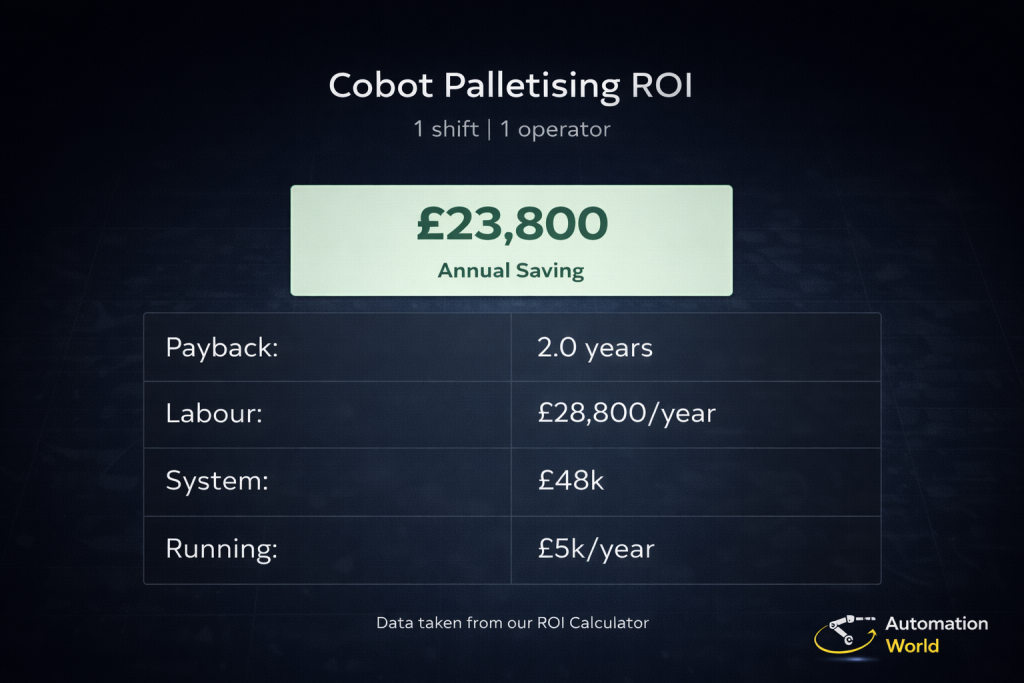
A single-shift drinks manufacturer, one palletising operator paid £12/hour. No agency dependency, no downstream bottleneck. The all-in annual cost for that role is around £28,800. The cobot cell costs £48,000 installed, with running costs of around £5,000 a year.
Net annual saving: £23,800. Payback: just over 2 years.
That’s harder to get approved internally than the first example, but it’s still a reasonable return on equipment that runs for 10+ years. The danger is building the case on optimistic assumptions, if running costs come in higher or the saving is partially offset by redeployment complexity, a 2-year payback can drift to 3. Present the base case honestly, and the project either stands on its own or it doesn’t.
What skews the numbers
Redeployment vs headcount reduction: getting this right in your business case
This is the variable that most often causes a palletising automation business case to fall apart in internal approval. Get it wrong and a finance director will pull the thread until the whole case unravels.
The question is simple, when the robot takes over the palletising role, what actually happens to the person who was doing it?
There are three realistic outcomes, and each has a different value in your ROI calculation.
Full headcount reduction. The role is removed and the cost is fully saved. This is the cleanest case. If the position is currently held by an agency worker or a fixed-term contract, this is straightforward to model and defend. If it’s a permanent employee, it involves a redundancy process with associated costs, factor those into your first-year numbers.
Redeployment to a productive role. The operator moves to a different part of the operation where they add genuine value, quality checking, picking, line support. The palletising labour cost is still freed up in the sense that you’re no longer spending it on palletising, but whether it shows as a saving depends on whether that redeployment displaces agency spend, fills a gap, or simply adds a person to an area that was already adequately staffed. Be precise about which of those is actually happening.
Speculative redeployment. The business case says the operator will be redeployed but there’s no specific role identified. Finance directors recognise this immediately. If you can’t name the role and quantify its value, don’t book it as a saving, present it as a cost that remains neutral rather than a saving that materialises. A conservative base case that holds up is worth more than an optimistic case that gets challenged.
The practical advice, before you finalise your business case numbers, confirm in writing with HR or operations what the headcount outcome will actually be. It takes the ambiguity out of the approval process and makes the ROI figure defensible.
Throughput bottleneck value cuts both ways. If fixing a palletising bottleneck lets your line run 15% faster, model that as additional throughput revenue, but only if you have the demand to fill that extra capacity. An empty 15% uplift in theoretical throughput is worth nothing if the order book doesn’t support it.
Grant funding can shift payback materially. UK manufacturers have periodically been able to access funding through schemes like UKRI’s Innovate UK or sector-specific programmes that offset capital spend on automation. These aren’t guaranteed and the landscape changes, so don’t build your primary business case around grant income, but it’s worth checking what’s available when you’re putting numbers together.
Service contract terms vary more than most people expect. Getting 2 or 3 integrators to quote, and comparing not just the system price but the ongoing support costs and response time commitments, often reveals differences of £2,000–£3,000 per year on identical-looking systems.
Building a business case that holds up
A business case that survives a finance director is usually built around conservative assumptions and a range of scenarios rather than a single best-case number. Present a base case, a conservative case (higher downtime, partial rather than full redeployment) and a best case. If the project is viable in the base case, that’s a solid foundation. Ultimately, not all applications are ready for automation, and you should check if your process meets the minimum levels for going down the automation route.
One figure that often helps is total cost of ownership over the expected life of the system, expressed as cost per case palletised. A robot that costs £80,000 all-in and runs for 10 years at 500,000 cases per year costs less than 2p per case in capital terms. Put against a fully-loaded labour cost of 8–10p per case, that’s a straightforward comparison.
Before you go into any of those conversations, the automation ROI calculator lets you model your own numbers properly rather than relying on estimates from people trying to sell you something. And when you’re ready to talk to integrators the supplier directory has UK specialists and the project matcher puts you in front of UK specialists who’ll give you realistic figures rather than a best-case pitch.
Once your numbers are in order, the next step is getting realistic quotes. The Project Matcher puts you in front of UK integrators who’ll price your specific application rather than give you a brochure figure.
Frequently Asked Questions
What is the typical payback period for a palletising robot in the UK?
It depends primarily on how many shifts you’re running and how much of the labour cost is genuinely saved rather than redeployed. For a two-shift operation with two operators, payback periods of 6–18 months are achievable with a cobot cell. For a single-shift operation with one operator, 2–3 years is more typical. Operations running three shifts or 24/7 often see payback inside 12 months even on higher-spec traditional robot systems.
How much does a palletising robot system cost in the UK?
A cobot-based palletising cell from a UK integrator typically starts at £50,000–£80,000 for a single-product application, including installation. A traditional industrial robot cell with full safety fencing and conveyor integration sits more like £80,000–£200,000 depending on throughput and site complexity. On top of the system price, budget at least 15–20% for implementation costs including electrical work, civil preparation, and conveyor integration, these are often not included in the headline quote.
What ongoing costs should I include in a palletising robot ROI calculation?
The main running costs are the annual service contract (typically £3,000–£8,000 per year depending on system type and response time commitments), energy consumption (relatively low, most cells run on standard three-phase supply), and periodic replacement of end-of-arm tooling components. Programming changes are worth including if your product mix changes regularly, for a traditional robot these typically require a specialist engineer at £600–£1,200 per day, while cobot reprogramming can usually be handled in-house by a trained operator.